
Appearance
A full session, step by step
This page follows one recorded BNBUSDT cycle from an empty grid to a closed position, so every idea from the concept pages is visible on live data at once. It sits on top of the classic DCA / Grid with the Hybrid layer on — read it after those, with the summary bar, the badges, and the ✓ / ✗ marks already in hand.
The seven moments below are in trading order — what the position was doing, not when the picture was taken. Every screenshot is shrunk to fit the page; click one to open it full-size in a new tab.
Demo screenshots
The screenshots use Binance testnet / demo funds. The balances, prices, and banked profit shown here illustrate how the interface behaves; they are not financial advice or a promise of live-market results.
The setup
Every screenshot uses the same build. Only the four hybrid knobs and the live state change from here on.
| Setting | Value |
|---|---|
| Pair / side | BNBUSDT, Long |
| Order Size | 0.018 |
| Progression | Fibonacci · Martingail 72 · step 0.04 |
| Profit / Commission | 0.4 / 0.20 |
| Grid from order | 3 — the scalp may only run on rung #3 and deeper |
| Micro profit % | 0.1 |
| Grid exit % | 50, with Auto exit ON |
| Active orders | 3 |
| Hybrid grid | ON · Expert Mode OFF |
The plan lays a 12-rung ladder from #1 @ 570.62 down to #12 @ 489.78, each rung bigger than the last, with a whole-position sell planned above every entry.
1. Armed and empty
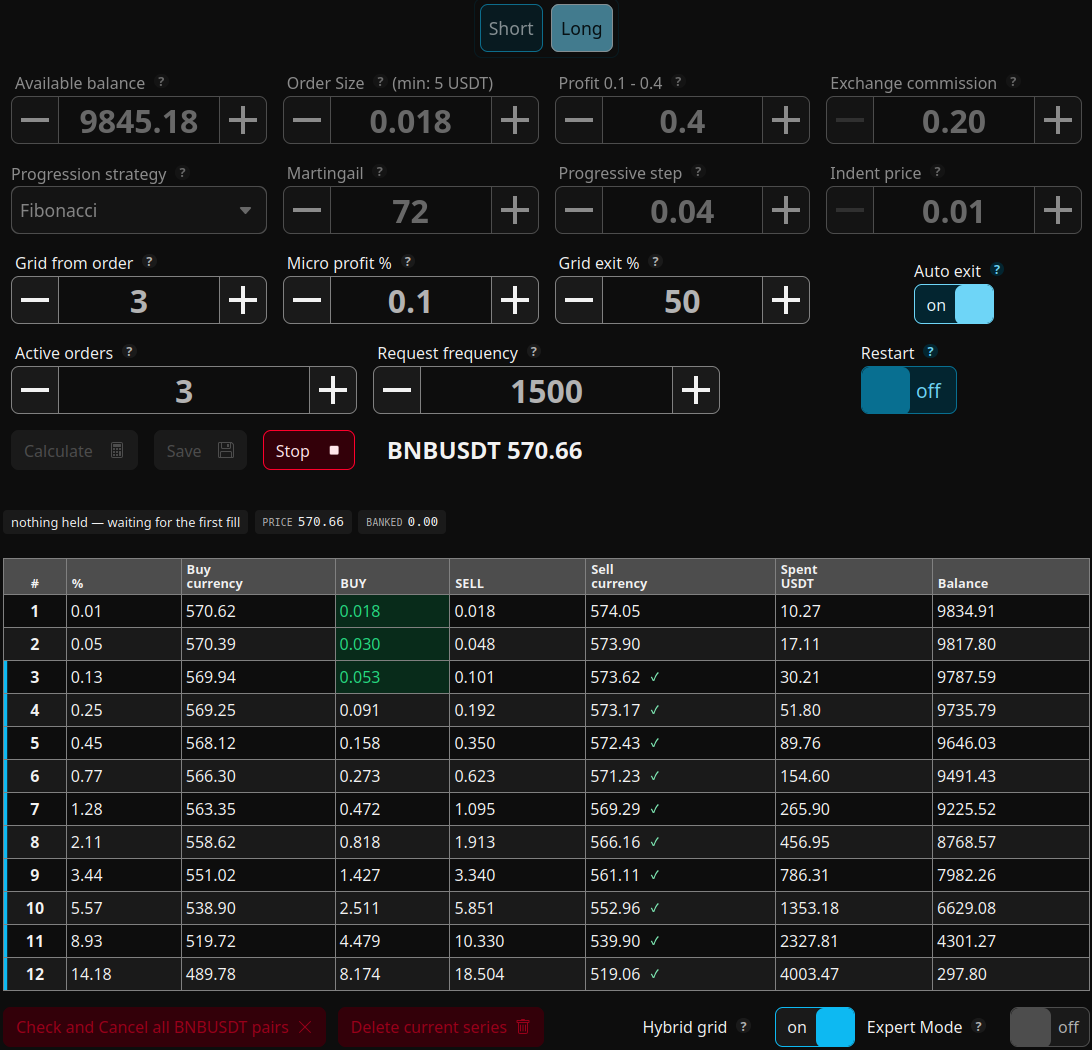
The bar reads nothing held — waiting for the first fill · price 570.66 · banked 0.00. Nothing has filled yet: the two shallow BUY rungs rest in green just under price, and rungs #3 and below carry a green ✓ — the fit forecast saying if this rung fills, the scalp will be allowed here. Rungs #1 and #2 have no mark because they sit above Grid from order 3 and never scalp. Grid exit is still at its default 50.
2. The ladder fills to #5, and the scalp arms
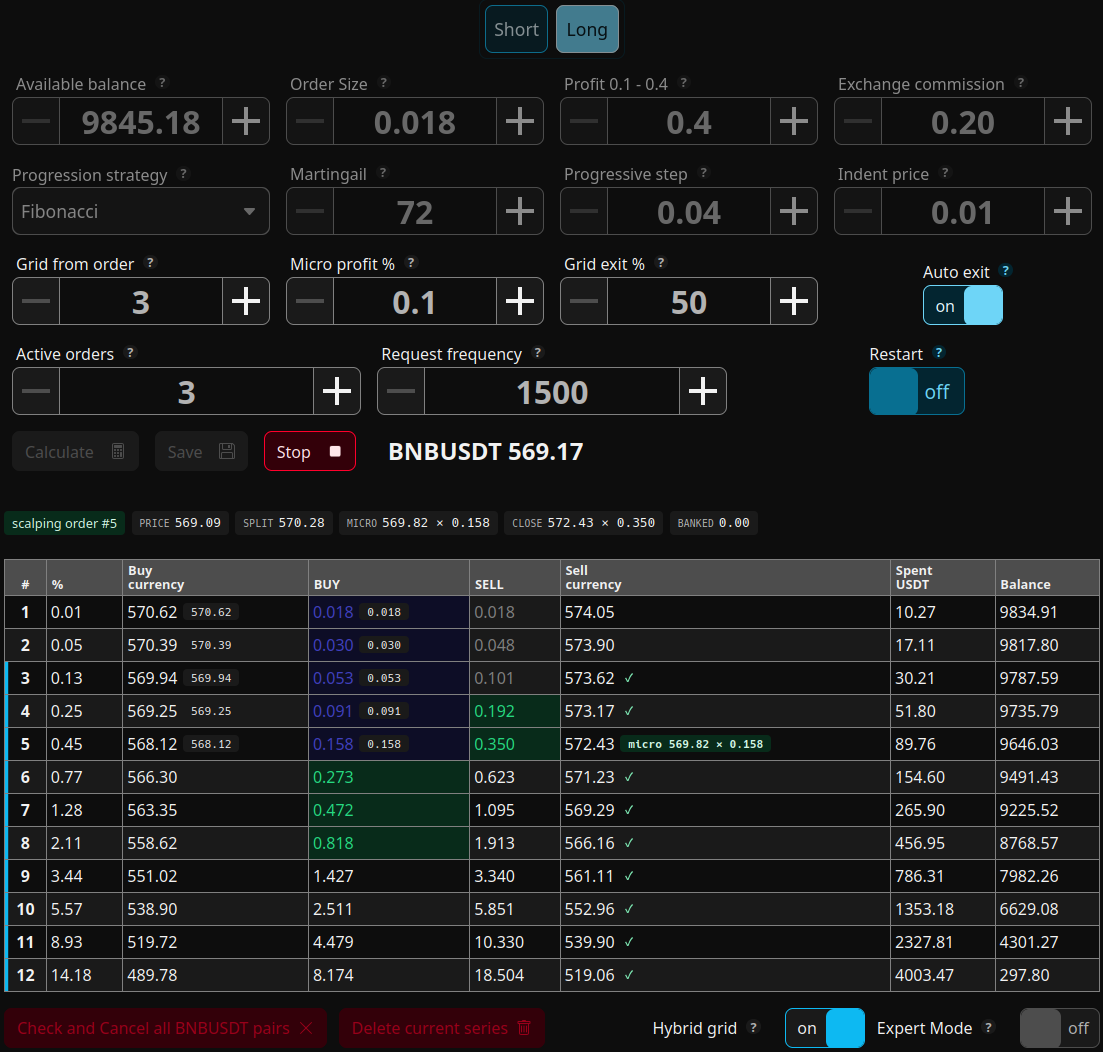
Price fell to ~569 and the DCA ladder did its job: rungs #1–#5 filled (grey fill badges on each BUY). The deepest filled rung, #5, is now the carrying rung, and the bar shows the scalp live:
scalping order #5· split570.28· micro569.82 × 0.158· close572.43 × 0.350· banked0.00
The green micro 569.82 × 0.158 badge on row #5 is a limit SELL of that rung's own slice, priced just above where #5 bought. Above it sits the whole-position close at 572.43. The split at 570.28 is the Grid exit % line the micro may not cross — right now it has room, so the micro is on the book.
3. First bounce banked — Auto exit raises Grid exit 50 → 69
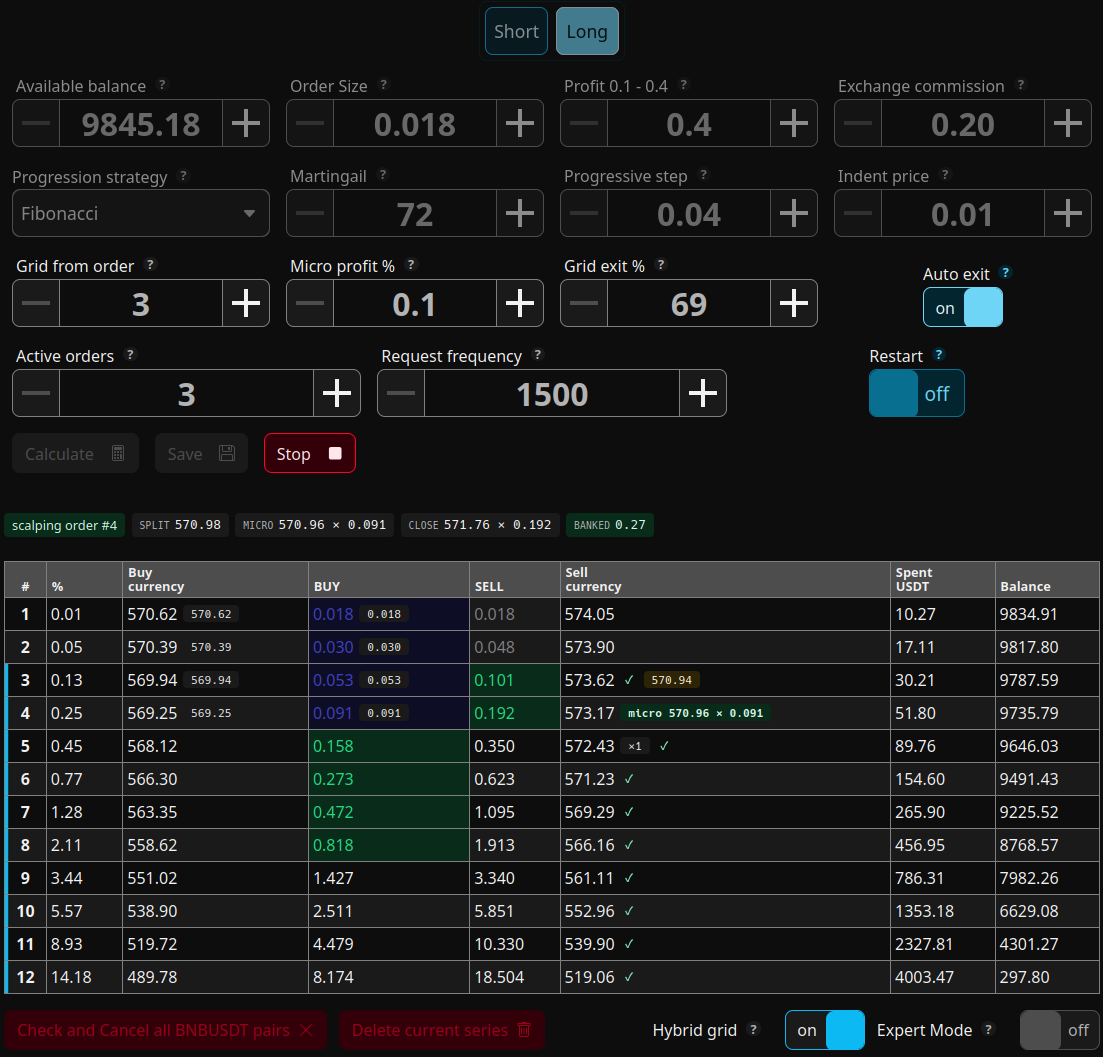
Price ticked back up, the micro filled, and the bot re-sold rung #5's volume — the position is pulled back up to #4 as the carrying rung. Row #5 now shows a grey ×1 ✓: that rung banked one bounce. The result is in the bar:
scalping order #4· split570.98· micro570.96 × 0.091· close571.76 × 0.192· banked0.27
Two things moved on their own:
- Grid exit jumped from 50 to 69. The micro on the shallower rung #4 didn't fit under the old split, so Auto exit raised Grid exit to the value that does fit — no manual touch. That is why the split climbed to
570.98. - The close pulled in from
572.43to571.76. Banking a bounce lowers the effective exit: the wait is now shorter than the original plan.
4. Price dips again — #5 re-fills, the close settles on the tail
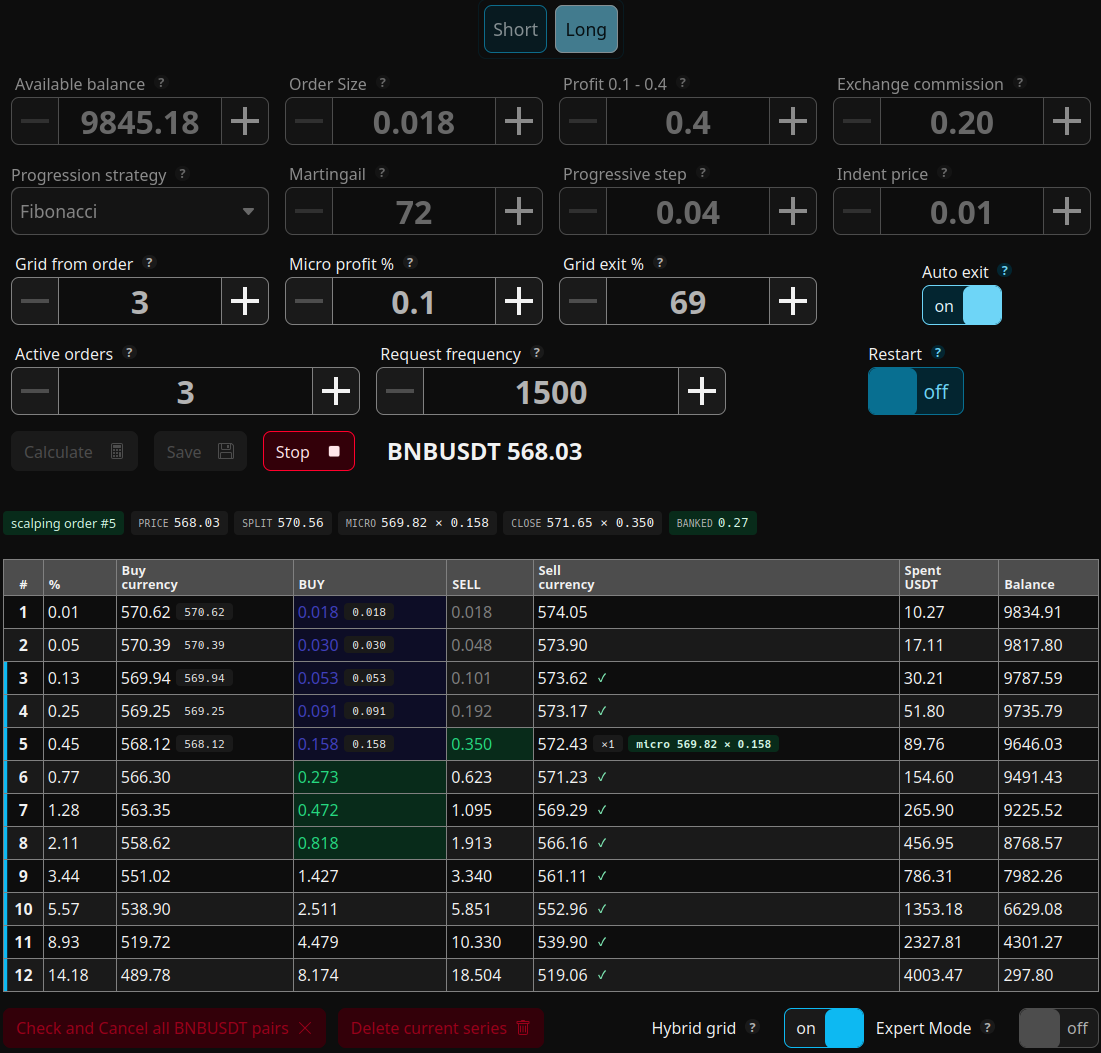
Price slid back to 568.03, rung #5 re-filled, and a fresh micro armed on it — 569.82 × 0.158 again. Row #5 keeps its ×1 ✓ counter from the bounce it already banked; banked holds at 0.27 because a re-entry banks nothing by itself.
scalping order #5· price568.03· split570.56· micro569.82 × 0.158· close571.65 × 0.350· banked0.27
A moment later, the whole-position close finishes re-pricing and lands on the tail rung as a yellow badge:
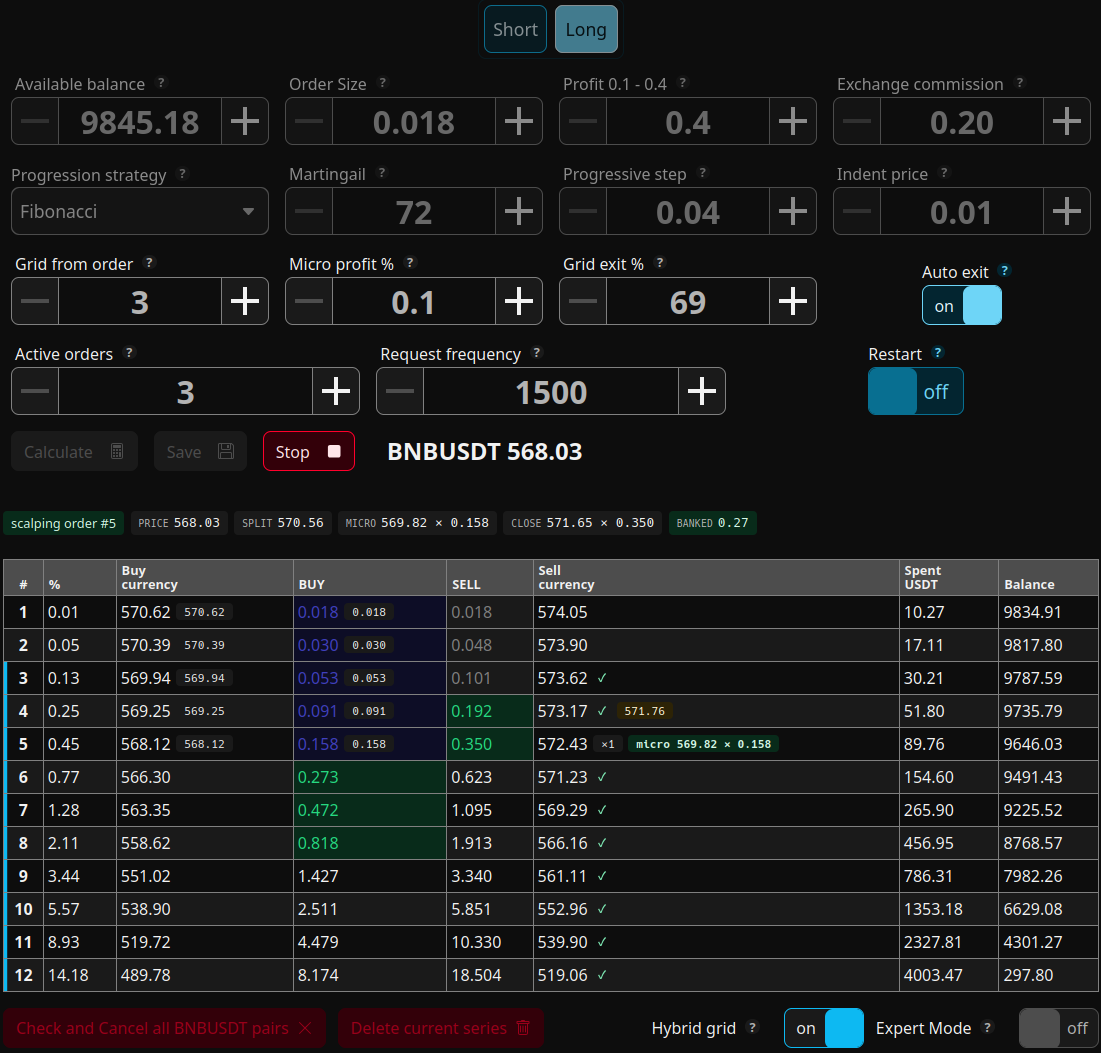
The yellow 571.76 on row #4 is the recomputed close resting above the carrying rung — the single order that will end the cycle, sized to the whole position and recomputed from real fills, so it drifts off the plan column.
5. Second bounce banked — but the micro can't fit on #4
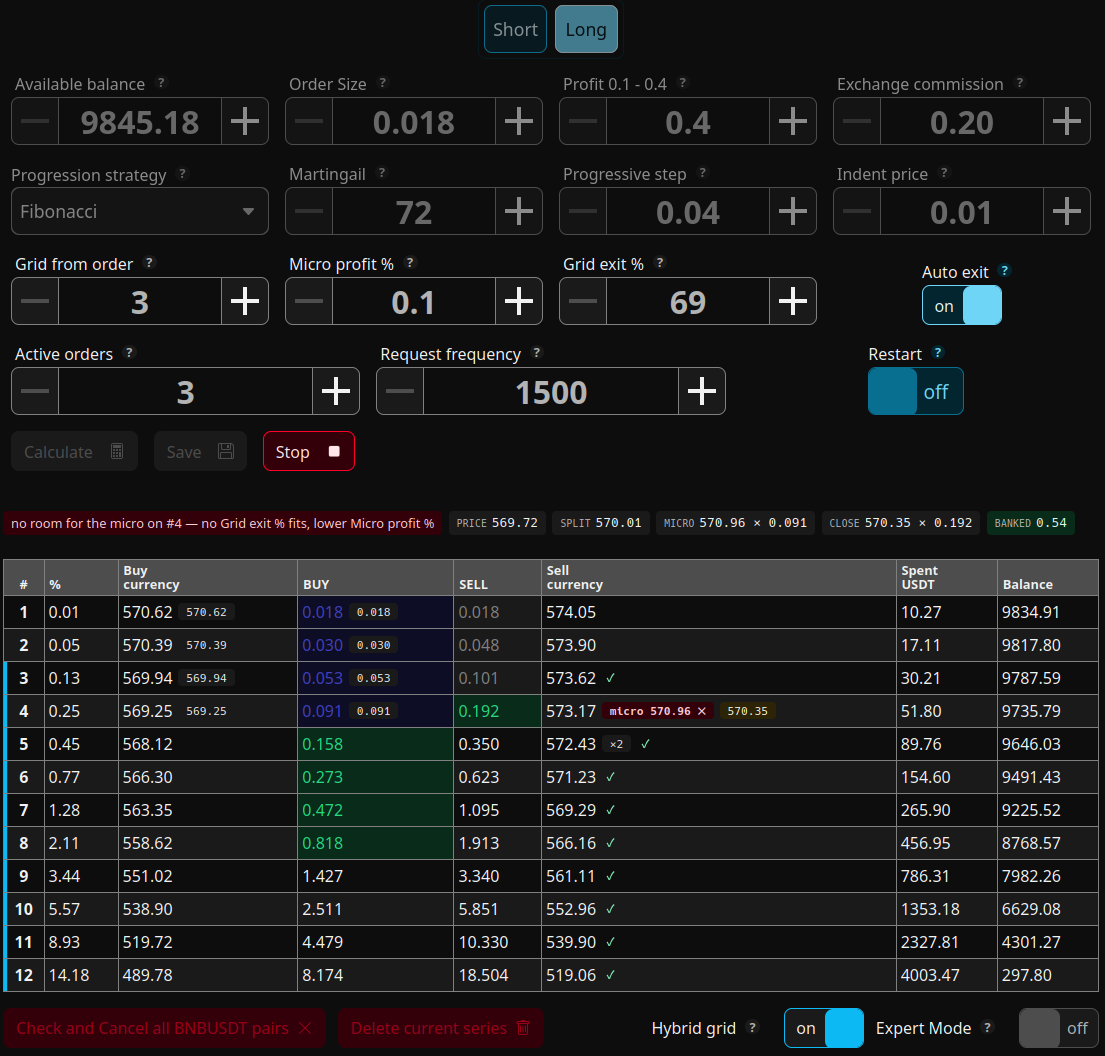
Another up-move banked a second bounce: row #5 now reads ×2 ✓, banked climbs to 0.54, and the position is pulled up to #4 again. This time the bar turns red:
no room for the micro on #4 — no Grid exit % fits, lower Micro profit %· price569.72· split570.01· micro570.96 × 0.091· close570.35 × 0.192· banked0.54
Rung #4 is shallow, so the gap between its entry and the close is tiny — and by now the close has pulled all the way in to 570.35. Even at Grid exit 69 the micro would have to cross the split, so it is blocked: the red micro 570.96 ✕ on row #4 says the slice can't be placed. Here Auto exit can do no more — no Grid exit value fits, so the bar names the other lever, lower Micro profit %. Until then the cycle simply waits as plain DCA, the yellow 570.35 close resting on the tail.
This is expected near the top of the zone
A ✗ on a shallow rung is normal: the entry-to-close gap up there is too small for even a 0.1 % micro. Deeper rungs open the gap and scalp freely — which is exactly what #5 did twice.
6. The position closes — banked on top
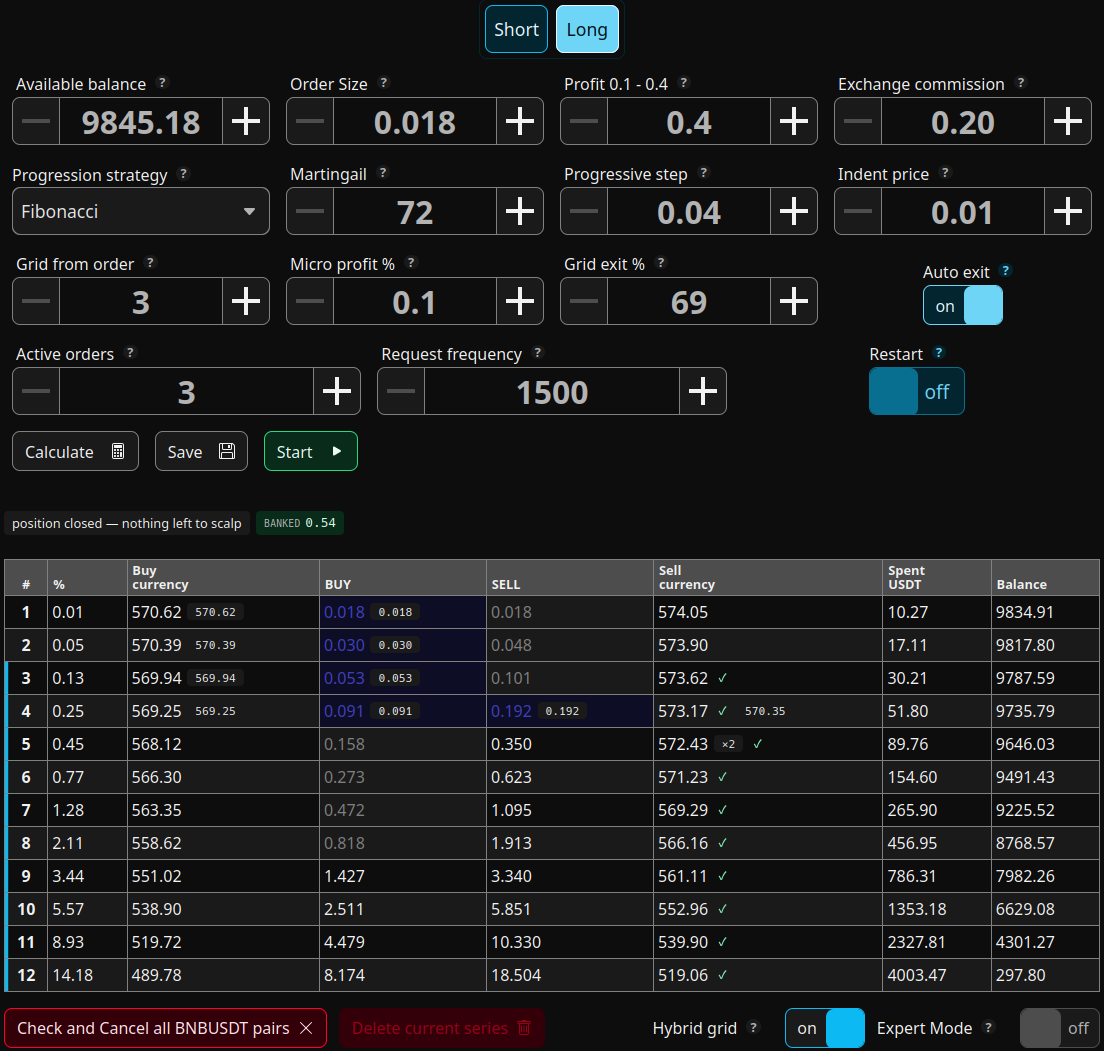
Price rose to the whole-position close and the entire position sold at a profit — the button flips back to green Start, and the bar reports position closed — nothing left to scalp · banked 0.54.
The cycle earned twice over:
- the whole-position exit closed the averaged DCA position for its planned profit, at a close (
570.35) that the scalp had already pulled 2 USDT below where it started (572.43); and - the two micro bounces (row #5's
×2) banked0.54on the side while the position was merely waiting.
That is the hybrid in one session: the DCA ladder averaged the entry down and closed the whole position as usual, and the micro-scalp turned the sideways wait into banked profit — automatically widening the exit's headroom (Auto exit 50 → 69) and pulling the exit itself closer along the way.